KEDA on Azure: Troubleshooting Event-Driven Autoscaling Issues
Kubernetes Event-driven Autoscaling (KEDA) is a powerful component that extends the capabilities of Kubernetes, enabling workloads to scale based on the number of events needing to be processed. When deployed as an add-on to Microsoft Azure Kubernetes Service (AKS), KEDA streamlines the management of autoscaling, providing a robust solution for dynamic application scaling. However, like any complex system, users may encounter configuration challenges or operational issues that hinder its effectiveness. This article serves as a comprehensive guide to diagnosing and resolving common problems encountered with the KEDA AKS add-on, going beyond the basic troubleshooting steps to offer in-depth insights and solutions.
Understanding KEDA on Azure Kubernetes Service
KEDA fundamentally changes how applications scale in Kubernetes by allowing them to react to events from external sources. Instead of relying solely on CPU or memory utilization, KEDA enables scaling based on metrics like queue length, message count, or database lag. This event-driven approach ensures that resources are allocated precisely when needed, optimizing costs and improving application responsiveness. The KEDA add-on for AKS simplifies its deployment and lifecycle management, integrating it seamlessly into the Azure ecosystem.
How KEDA Works
At its core, KEDA introduces two primary Kubernetes custom resources: ScaledObject and TriggerAuthentication. A ScaledObject defines the scaling rules for a deployment, specifying which scaler to use (e.g., Azure Storage Queue, Kafka, Prometheus) and the target metric values. KEDA then dynamically creates and manages a Horizontal Pod Autoscaler (HPA) resource based on these definitions. The TriggerAuthentication resource, optionally used, handles authentication details for external sources, often using managed identities or secrets, ensuring secure access without hardcoding credentials.
The KEDA architecture consists of two main components:
* KEDA Operator: This component watches for ScaledObject and TriggerAuthentication resources. It then creates and updates HPA resources based on the defined scaling rules and monitors external event sources through various scalers.
* KEDA Metrics Adapter: This acts as a custom metrics API server, exposing metrics from external event sources to the Kubernetes HPA. The HPA queries this adapter for metric values to determine when to scale pods up or down.
This sophisticated interplay allows applications to scale out efficiently during peak event loads and scale in when demand subsides, leading to significant resource optimization. The KEDA add-on on AKS manages these components, ensuring they are correctly configured and maintained, thereby reducing operational overhead for users.
Prerequisites for Troubleshooting
Before diving into specific troubleshooting steps, ensure you have the necessary tools and access to your AKS cluster. These tools are fundamental for interacting with Kubernetes and diagnosing issues effectively. Familiarity with their basic commands will greatly assist in the troubleshooting process.
- Kubernetes
kubectltool: This command-line tool allows you to run commands against Kubernetes clusters. You can usekubectlto deploy applications, inspect and manage cluster resources, and view logs. To installkubectlconveniently through the Azure CLI, execute theaz aks install-clicommand. This ensures you have the correct version compatible with your AKS cluster. - Azure CLI: The Azure command-line interface is crucial for managing Azure resources, including your AKS cluster. You’ll use it to retrieve cluster credentials, perform cluster-level diagnostics, and manage networking configurations. Ensure you are logged in to the correct Azure subscription and have the necessary permissions to manage AKS resources.
- Cluster Access: Verify that your
kubectlcontext is correctly set to your target AKS cluster. You can do this by runningkubectl config current-contextandkubectl get nodes. If the context is incorrect or you lack access, useaz aks get-credentials --resource-group <your-resource-group> --name <your-aks-cluster-name>to configure yourkubectlfor the desired cluster.
KEDA Add-on Support Model on AKS
Understanding the support boundaries for the KEDA add-on on AKS is vital for efficient issue resolution. The KEDA add-on follows a consistent support model similar to other AKS add-ons, ensuring a predictable and reliable experience for users. This model clarifies which components are officially supported and where to seek assistance for specific issues.
Microsoft fully supports all Azure KEDA scalers. These scalers are designed and tested to integrate seamlessly with various Azure services, providing robust event-driven autoscaling capabilities. If you encounter any issues related to Azure KEDA scalers or the core KEDA add-on components, Microsoft support is available to assist you. This covers the KEDA operator, metrics adapter, and their interaction with the Kubernetes API and Azure services.
However, AKS does not officially support third-party scalers. While KEDA’s open-source nature allows for a wide array of community-contributed scalers for various platforms and technologies, these are outside the scope of Microsoft’s direct support for the AKS add-on. If your autoscaling issues stem from the use of third-party scalers, the recommended course of action is to open an issue directly in the official KEDA GitHub repository. The KEDA community and maintainers are the best resources for troubleshooting and resolving problems specific to these unsupported scalers.
Always verify the type of scaler you are using when diagnosing issues. This distinction helps in directing your troubleshooting efforts to the correct support channel, ensuring a quicker and more effective resolution process. Leveraging the strengths of both Microsoft support for Azure-specific components and the KEDA community for broader issues is key to maintaining a healthy autoscaling environment.
Comprehensive Troubleshooting Checklist
When KEDA encounters issues, a systematic approach to troubleshooting is essential. The following sections provide a detailed checklist to verify and troubleshoot the core components and common misconfigurations associated with the KEDA add-on. By following these steps, you can effectively pinpoint the root cause of autoscaling failures and implement the appropriate solutions.
1. Verify KEDA Add-on Version and Health
The first step in any troubleshooting process is to confirm that KEDA is installed, active, and functioning correctly. Checking the installed version can also help in identifying potential compatibility issues or known bugs associated with specific releases.
Check the Available KEDA Version
To determine the exact version of the KEDA add-on installed on your AKS cluster, use the kubectl get command. This command queries the Custom Resource Definition (CRD) for ScaledObjects, which typically includes version labels.
kubectl get crd/scaledobjects.keda.sh -o custom-columns='APP:.metadata.labels.app\.kubernetes\.io/version'
The command output will display the installed version of KEDA, for example:
APP
2.8.1
Knowing the KEDA version is crucial, as some issues might be specific to certain releases or require an upgrade to a newer, more stable version. Always refer to the official KEDA documentation and release notes for version-specific information.
Check KEDA Pod Status and Logs
Beyond just the version, ensuring the KEDA operator and metric server pods are healthy and running without errors is paramount. These pods are the heart of the KEDA system.
-
List KEDA Pods: Identify the KEDA operator and metric server pods in the
kube-systemnamespace.kubectl get pods -n kube-system -l app.kubernetes.io/name=kedaYou should see pods like
keda-operator-...andkeda-operator-metrics-apiserver-...in aRunningstate. -
Inspect Pod Status: Check the status and events of these pods for any anomalies.
kubectl describe pod <keda-operator-pod-name> -n kube-system
kubectl describe pod <keda-operator-metrics-apiserver-pod-name> -n kube-system
Look for
WarningsorErrorsin the Events section that might indicate initialization failures or persistent issues. -
Review Pod Logs: The logs provide detailed information about what the KEDA components are doing and any errors they encounter.
kubectl logs <keda-operator-pod-name> -n kube-system
kubectl logs <keda-operator-metrics-apiserver-pod-name> -n kube-system
Pay close attention to error messages, especially during startup or when scaling events are expected. Common log entries might point to network issues, permission problems, or misconfigured
ScaledObjectresources.
2. Cluster Firewall and Network Configuration
One of the most frequent culprits behind KEDA’s inability to scale applications effectively is a misconfigured cluster firewall or network egress rules. KEDA requires outbound access to the Kubernetes API server and, often, to external event sources (e.g., Azure Service Bus, Azure Storage Queues).
Diagnosing Network Connectivity Issues
If KEDA cannot start or communicate properly, you might observe error entries in the operator logs similar to the following:
1.6545953013458195e+09 ERROR Failed to get API Group-Resources {"error": "Get \"https://10.0.0.1:443/api?timeout=32s\": EOF"}
sigs.k8s.io/controller-runtime/pkg/cluster.New
/go/pkg/mod/sigs.k8s.io/controller-runtime@v0.11.2/pkg/cluster/cluster.go:160
sigs.k8s.io/controller-runtime/pkg/manager.New
/go/pkg/mod/sigs.k8s.io/controller-runtime@v0.11.2/pkg/manager/manager.go:313
main.main
/workspace/main.go:87
runtime.main
/usr/local/go/src/runtime/proc.go:255
1.6545953013459463e+09 ERROR setup unable to start manager {"error": "Get \"https://10.0.0.1:443/api?timeout=32s\": EOF"}
main.main
/workspace/main.go:97
runtime.main
/usr/local/go/src/runtime/proc.go:255
And specifically in the metric server section, KEDA might fail to initialize:
I0607 09:53:05.297924 1 main.go:147] keda_metrics_adapter "msg"=\"KEDA Version: 2.7.1\"\nI0607 09:53:05.297979 1 main.go:148] keda_metrics_adapter "msg"=\"KEDA Commit: \"\nI0607 09:53:05.297996 1 main.go:149] keda_metrics_adapter "msg"=\"Go Version: go1.17.9\"\nI0607 09:53:05.298006 1 main.go:150] keda_metrics_adapter "msg"=\"Go OS/Arch: linux/amd64\"\nE0607 09:53:15.344324 1 logr.go:279] keda_metrics_adapter "msg"=\"Failed to get API Group-Resources\" \"error\"=\"Get \\\"https://10.0.0.1:443/api?timeout=32s\\\": EOF\"\nE0607 09:53:15.344360 1 main.go:104] keda_metrics_adapter "msg"=\"failed to setup manager\" \"error\"=\"Get \\\"https://10.0.0.1:443/api?timeout=32s\\\": EOF\"\nE0607 09:53:15.344378 1 main.go:209] keda_metrics_adapter "msg"=\"making provider\" \"error\"=\"Get \\\"https://10.0.0.1:443/api?timeout=32s\\\": EOF\"\nE0607 09:53:15.344399 1 main.go:168] keda_metrics_adapter "msg"=\"unable to run external metrics adapter\" \"error\"=\"Get \\\"https://10.0.0.1:443/api?timeout=32s\\\": EOF\"\n```
The `EOF` error (End-Of-File) in this context typically indicates that the connection to the Kubernetes API server (at `https://10.0.0.1:443/api` in the example) was abruptly closed, often due to a network-level blockage. This scenario strongly suggests that the KEDA add-on pods are unable to communicate with the API server, preventing them from starting correctly.
#### Resolution Steps for Firewall Issues
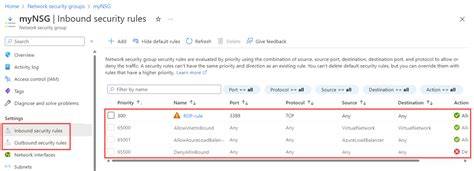
To ensure KEDA runs correctly, your cluster's network configuration, including firewalls and Network Security Groups (NSGs), must allow the necessary outbound traffic.
1. **Verify Azure Global Required Network Rules:** Configure your firewall to meet the [Azure Global required network rules](https://learn.microsoft.com/en-us/azure/aks/limit-egress-traffic#azure-global-required-network-rules). These rules cover essential Azure infrastructure services, including Azure Active Directory, resource management, and various monitoring services. Missing these can prevent core Kubernetes and AKS components from functioning.
2. **Allow AKS API Server Access:** Ensure that the AKS worker nodes (where KEDA pods run) have outbound access to the AKS control plane's API server. This typically involves allowing traffic on port 443 to the API server's IP address. For private AKS clusters, ensure proper VNet peering, private DNS zone configuration, and network policies are in place.
3. **Allow Access to External Event Sources:** If KEDA is scaling based on an Azure service (e.g., Service Bus, Storage Queue, Event Hubs), ensure that your cluster's egress rules permit outbound connections to these specific Azure service endpoints. This may require adding FQDNs or service tags to your Azure Firewall or NSG rules.
4. **Check DNS Resolution:** Verify that DNS resolution is working correctly within your cluster for both internal (Kubernetes API server) and external (Azure services) endpoints. Incorrect DNS settings can manifest as connectivity issues.
5. **Use Network Observability Tools:** Utilize tools like `kubectl exec` into a pod and `ping`, `curl`, or `nslookup` commands to test connectivity from within your KEDA pods to the problematic endpoints. This can help isolate whether the issue is network-wide or specific to the KEDA pods.
### 3. Enabling the Add-on with Existing Open-Source KEDA Installations
A common scenario that can lead to unexpected behavior is attempting to enable the KEDA AKS add-on on a cluster that already has a self-managed, open-source KEDA installation. Kubernetes allows only one metrics server to be registered at a time. This constraint means that while you *can* install multiple KEDA instances, only one will be active as the metrics provider for HPA.
#### The Conflict Explained
When the KEDA add-on is installed on an AKS cluster that already hosts an open-source KEDA deployment, the add-on will overwrite and take precedence as the official metrics server. This transition has significant implications:
* **Customization Loss:** Any custom configurations, CRD definitions, or specific operational settings applied to your self-installed KEDA deployment will be lost or ignored. The add-on will deploy with its default, managed configuration.
* **Feature Discrepancy:** The AKS KEDA add-on is configured differently from a vanilla open-source installation. For instance, the add-on is designed to integrate seamlessly with Azure-specific features like managed identity, which might not be supported or configured in the same way in a self-managed setup.
* **Autoscaling Instability:** While existing `ScaledObject` resources might continue to function initially, the underlying metrics provider has changed. This can introduce subtle behavioral differences, potential instability, or prevent new autoscaling configurations from working as expected.
To prevent errors and ensure a clean, supported autoscaling environment, it is **strongly recommended** that you uninstall any existing self-managed KEDA installations *before* you enable the KEDA add-on on your AKS cluster. This ensures a smooth transition to the managed add-on and avoids conflicts with the metrics API.
#### Identifying the Active Metrics Adapter
You can determine which metrics adapter is currently being used by Kubernetes to serve external metrics by querying the `APIService` resource:
```bash
kubectl get APIService/v1beta1.external.metrics.k8s.io -o custom-columns='NAME:.spec.service.name,NAMESPACE:.spec.service.namespace'
The output will clearly show the service and namespace that Kubernetes is configured to use for fetching external metrics. For an AKS cluster with the KEDA add-on, you should expect to see something similar to this:
NAME                              NAMESPACE
keda-operator-metrics-apiserver   kube-system
If you see a different service or namespace, it indicates that a non-add-on KEDA (or another metrics provider) is currently active. In such cases, plan your migration carefully, uninstalling the old instance before enabling the AKS add-on.
Migration Steps
- Backup KEDA Configurations: Save all your
ScaledObjectandTriggerAuthenticationYAML definitions from the existing cluster. - Uninstall Self-Managed KEDA: Follow the official KEDA documentation for uninstalling your specific version of KEDA. This typically involves using Helm or deleting the KEDA namespaces and CRDs.
- Enable KEDA Add-on: Enable the KEDA add-on on your AKS cluster through the Azure portal or Azure CLI (
az aks update --enable-keda ...). - Reapply Configurations: Once the add-on is active and healthy, reapply your
ScaledObjectandTriggerAuthenticationYAML files. - Verify Functionality: Monitor KEDA logs and ensure autoscaling is working as expected.
4. Workload Identity Integration Issues
Microsoft Entra Workload ID (formerly Azure AD Workload Identity) provides a secure way for applications running in Kubernetes to access Azure resources using managed identities. When KEDA needs to access Azure event sources, it often relies on Workload ID for authentication. However, if KEDA is enabled before Workload ID is fully configured or utilized, its operator pods might not receive the necessary environment variables for proper authentication.
The Problem: Missing Environment Variables
Workload ID works by injecting specific environment variables into the pod where the application (in this case, the KEDA operator and metric server) is running. These variables, such as AZURE_TENANT_ID, AZURE_FEDERATED_TOKEN_FILE, and AZURE_AUTHORITY_HOST, are crucial for the KEDA components to authenticate with Azure services using the assigned managed identity. If these variables are not present, KEDA will fail to connect to Azure-based event sources, leading to autoscaling failures.
The most common reason for these variables to be missing is that the KEDA operator pods were already running when Workload ID was enabled or configured on the AKS cluster. Pods typically inherit their environment variables at creation time.
How to Restart KEDA Operator Pods for Workload Identity
To resolve this, you must restart the KEDA operator pods. This action forces Kubernetes to recreate the pods, allowing Workload ID to inject the correct environment variables during the new pod’s startup sequence.
Follow these steps to ensure Workload ID is properly integrated:
-
Restart the KEDA Operator Deployment: Initiate a rolling restart for the KEDA operator deployment. This will gracefully terminate existing pods and create new ones, ensuring the latest configuration is picked up.
kubectl rollout restart deployment keda-operator -n kube-systemWait for the rollout to complete and for the new pods to be in a
Runningstate. -
Identify New KEDA Operator Pods: Obtain the names of the newly created KEDA operator pods.
kubectl get pod -n kube-system -l app.kubernetes.io/name=keda-operatorLocate the pods with names starting with
keda-operator(they will have new suffixes after the restart). -
Verify Environment Variable Injection: Inspect one of the new KEDA operator pods to confirm that the Workload ID environment variables have been successfully injected.
kubectl describe pod <keda-operator-pod-name> -n kube-systemIn the Environment section of the output, you should now see entries for the following variables:
Environment Variable Purpose AZURE_TENANT_IDThe Azure Tenant ID for authentication. AZURE_FEDERATED_TOKEN_FILEPath to the federated token file for Workload ID. AZURE_AUTHORITY_HOSTThe Azure Authority host (e.g., https://login.microsoftonline.com/).If these variables are present with their respective values, Workload ID has been successfully configured for KEDA. If they are still missing, double-check your Workload ID configuration, including the federated identity credential and the service account annotation.
Common Workload Identity Configuration Checks
- Federated Identity Credential: Ensure you have created a federated identity credential for the managed identity that links it to the Kubernetes service account KEDA is using.
- Service Account Annotation: Verify that the Kubernetes service account used by KEDA (typically
keda-operatorinkube-system) is correctly annotated withazure.workload.identity/client-id: <managed-identity-client-id>. - Managed Identity Permissions: Confirm that the managed identity itself has the necessary permissions (e.g., “Azure Service Bus Data Receiver”) on the Azure resource it needs to access for scaling.
5. ScaledObject and Horizontal Pod Autoscaler Debugging
Even if KEDA components are healthy, misconfigurations in your ScaledObject definitions or issues with the resulting Horizontal Pod Autoscaler (HPA) can prevent scaling. These resources are critical for KEDA’s operation.
Inspecting ScaledObject Status
The ScaledObject resource holds the core logic for your autoscaling. Always inspect its status and events for immediate clues.
kubectl describe scaledobject <your-scaledobject-name> -n <your-namespace>
Key areas to review in the output:
* Status: Look for Ready and Active conditions. If not ready, examine the Message and Reason fields for details.
* Conditions: KEDA provides detailed conditions, such as AbleToFetchMetrics, Active, and Ready. Any False status here indicates a problem.
* Events: Events associated with the ScaledObject can highlight issues during its reconciliation, such as connectivity failures to the external scaler or parsing errors.
Inspecting Horizontal Pod Autoscaler (HPA)
KEDA generates an HPA resource based on your ScaledObject. The HPA is ultimately responsible for initiating scaling actions.
kubectl describe hpa <your-hpa-name> -n <your-namespace>
(The HPA name usually matches the deployment name specified in the ScaledObject.)
Important fields in HPA output:
* Conditions: Check for AbleToScale and ScalingActive conditions. If ScalingActive is False, the HPA is not performing autoscaling, and the Reason and Message will explain why (e.g., target metrics not available, invalid thresholds).
* Events: HPA events can show scaling up/down decisions, or errors if it cannot fetch metrics from the KEDA metrics adapter.
Common ScaledObject/HPA Issues
- Incorrect Metrics Configuration: Ensure the
metricNameandtargetvalues in yourScaledObjectmatch the expected metrics from the scaler. - Scaler Connectivity/Permissions: As discussed, the KEDA operator (and thus the HPA via the metrics adapter) needs proper access to the external event source. Errors in
ScaledObjector HPA events often point to these underlying issues. - Resource Limits: If your application pods are constantly hitting resource limits, the HPA might be unable to scale up effectively, or newly scaled pods might immediately encounter issues.
- Target Average Value: For HPA, ensure
targetAverageValueortargetValueinScaledObjectis set appropriately for your workload. Too low a value might cause over-scaling, while too high might cause under-scaling. - Cooldown and Polling Intervals: Review
cooldownPeriodandpollingIntervalin theScaledObject. Very short cooldowns can lead to “flapping,” while long polling intervals might delay scaling reactions.
Best Practices for KEDA on AKS
To minimize troubleshooting efforts and ensure a stable autoscaling environment, adhering to best practices is crucial. Proactive measures can prevent many common issues before they arise.
- Monitor KEDA Components: Regularly monitor the health and logs of the KEDA operator and metrics adapter pods. Integrate KEDA metrics into your existing monitoring solutions (e.g., Azure Monitor, Prometheus) to gain visibility into its performance and scaling decisions.
- Use Workload Identity: Leverage Microsoft Entra Workload ID for secure and auditable access to Azure resources. Avoid hardcoding connection strings or secrets directly into
ScaledObjectconfigurations. - Define Clear Resource Limits: Ensure your application pods, and the KEDA components themselves, have appropriate CPU and memory requests and limits. This prevents resource starvation that can impact autoscaling or KEDA’s operation.
- Test Scaling Configurations: Thoroughly test your
ScaledObjectconfigurations in non-production environments to validate scaling behavior under various load conditions. Observe how KEDA reacts to different event rates and fine-tune your parameters (e.g.,minReplicaCount,maxReplicaCount,pollingInterval,cooldownPeriod). - Keep KEDA and AKS Updated: Regularly update your AKS clusters and ensure your KEDA add-on is on a supported and stable version. This helps you benefit from bug fixes, performance improvements, and new features.
- Secure Network Egress: Implement robust network security policies (e.g., Azure Firewall, NSGs) to control outbound traffic from your AKS cluster. Ensure KEDA can only reach necessary Azure service endpoints and the Kubernetes API.
- Document ScaledObjects: Maintain clear documentation for your
ScaledObjectdefinitions, explaining the chosen scalers, target metrics, and expected scaling behavior.
Advanced Monitoring with KEDA and Azure
Effective monitoring is key to understanding KEDA’s behavior and quickly identifying potential issues. KEDA itself exposes metrics in a Prometheus-compatible format, which can be easily integrated with Azure’s monitoring capabilities.
Integrating KEDA Metrics with Azure Monitor
Azure Monitor and Container Insights can be configured to scrape Prometheus metrics from your AKS cluster. This allows you to visualize KEDA’s internal state, such as scaler metrics, HPA status, and ScaledObject conditions, alongside your application and cluster metrics.
- Enable Container Insights: Ensure Container Insights is enabled for your AKS cluster.
-
Configure ConfigMaps for Prometheus Scraping: Create a
ConfigMapin your cluster to configure the Container Insights agent to scrape KEDA’s Prometheus endpoints. KEDA typically exposes metrics on port8080for the operator and8080for the metrics adapter (if configured).apiVersion: v1 kind: ConfigMap metadata: name: container-azm-ms-agentconfig namespace: kube-system data: schema-version: v1 # Only collect prometheus metrics from keda-operator and keda-operator-metrics-apiserver # Example based on default KEDA installation labels config-version: 'v1' prometheus-data-collection-settings: |- [ prometheus_queries [ query = "kube_deployment_labels{namespace='kube-system', label_app_kubernetes_io_name='keda'}" query_name = "kube_keda_deployment_labels" ], [ query = "kube_pod_labels{namespace='kube-system', label_app_kubernetes_io_name='keda-operator'}" query_name = "kube_keda_operator_labels" ], [ query = "kube_pod_container_resource_limits_cpu_cores{namespace='kube-system', pod=~'keda-operator.*|keda-operator-metrics-apiserver.*'}" query_name = "keda_cpu_limits" ], [ query = "kube_pod_container_resource_limits_memory_bytes{namespace='kube-system', pod=~'keda-operator.*|keda-operator-metrics-apiserver.*'}" query_name = "keda_memory_limits" ] ] # You might need to add specific KEDA metric endpoints if they are not picked up by default. # Check KEDA documentation for exact metric names and ports. -
Create Custom Dashboards: Use Azure Workbooks or Grafana (connected to Azure Monitor) to create custom dashboards that visualize KEDA’s scaling metrics, allowing you to track the number of active scalers, current replica counts, and observed metric values over time.
This approach provides a holistic view of your AKS cluster’s health and autoscaling behavior, making it easier to identify performance bottlenecks or unexpected scaling patterns.
Visualizing KEDA Workflow with a Diagram
To further illustrate the interaction between KEDA components and how external events trigger scaling, consider the following Mermaid diagram, representing a simplified workflow for a KEDA-driven application. This visual aid can help in understanding the flow of information during autoscaling operations and in identifying potential points of failure.
mermaid
graph TD
    A[External Event Source] --> B{KEDA Scaler (e.g., Azure Service Bus)};
    B --> C[KEDA Operator];
    C -- Watches ScaledObject --> D[Kubernetes API Server];
    C -- Creates/Manages HPA --> E[Horizontal Pod Autoscaler (HPA)];
    E -- Queries Metrics --> F[KEDA Metrics Adapter];
    F -- Fetches Metrics --> B;
    E -- Scales Deployment --> G[Deployment (Application Pods)];
    D -- Updates Events/Status --> C;
    G -- Processes Events --> A;
This diagram shows that the External Event Source generates events, which are then observed by a specific KEDA Scaler. The KEDA Operator continuously watches for ScaledObject definitions via the Kubernetes API Server. Based on these definitions, it creates and manages an HPA. The HPA queries the KEDA Metrics Adapter, which in turn fetches the current event metrics from the KEDA Scaler. Finally, the HPA uses these metrics to decide whether to scale the application Deployment up or down.
Conclusion
Troubleshooting KEDA on Azure Kubernetes Service requires a methodical approach, encompassing checks from network connectivity to specific ScaledObject configurations. By understanding KEDA’s architecture, adhering to best practices, and systematically diagnosing issues using the provided steps, you can ensure your event-driven applications scale efficiently and reliably. Remember that proper monitoring and regular maintenance are key to a robust autoscaling environment.
Have you encountered other challenging KEDA issues on AKS? Share your experiences, questions, or additional troubleshooting tips in the comments below. Your insights can help the community build more resilient and efficient cloud-native applications!
Post a Comment